


Intel stands at the inflection point of its 56-year history. The 18A process node is either the foundation of a manufacturing renaissance or the final chapter of American semiconductor leadership. We break down the moat reconstruction, Panther Lake’s competitive positioning against AMD/QCOM/AVGO, and the $28-$65 valuation scenarios that define this binary bet.
Positioning: Intel (INTC) is executing the most ambitious strategic pivot in semiconductor history—transforming from a stumbling integrated device manufacturer into a “systems foundry” competing with TSMC for the world’s most advanced chip production. The Intel 18A node, now in high-volume manufacturing, represents the first 2nm-class process developed and manufactured entirely on U.S. soil.
What the stock is pricing: Not technology risk – execution risk. The stock dropped 17% on Friday after Q4 earnings showed soft Q1 guidance ($12.2B midpoint, down 11% sequentially), reminding investors that the turnaround is far from linear. The rally-then-collapse pattern reflects a market that wants to believe but hasn’t seen enough proof.
Key Points
→ Moat is being rebuilt on geopolitics, not just transistors: Intel is the only U.S.-based company with leading-edge logic R&D and manufacturing. The U.S. government converted $8.9B in CHIPS Act grants into a ~10% equity stake—creating a “sovereign moat” that aligns Washington’s interests directly with Intel’s success.
→ 18A is real, but yields are the swing factor: Intel claims yields are “progressing at predictable rates” and sufficient for Panther Lake production. Industry sources report yields exceeding 60%—a critical threshold for commercial viability. But management admits yields won’t be fully accretive to the cost structure until late 2026 or 2027.
→ Panther Lake wins on graphics, loses on NPU to Qualcomm: Intel’s Xe3 architecture delivers up to 73% better graphics performance than AMD’s Ryzen AI HX 370. But Qualcomm’s Snapdragon X2 Plus dominates dedicated AI processing with 80 TOPS vs. Intel’s 50 TOPS standalone NPU.
→ Apple foundry deal is the validation event: Intel has reportedly secured Apple as a foundry customer for MacBook and iPad processors starting 2027. If true, this validates 18A’s external viability and could trigger a significant re-rating.
→ Q3 2026 is the “red flag” deadline: Industry experts warn that if Intel doesn’t announce firm foundry contracts by end of Q3 2026, it signals deeper execution issues. The engagement-to-commitment conversion is the critical metric to track.
The Moat: From Eroded to Defensible (Maybe)
Intel’s competitive moat has fundamentally shifted. The old moat—process technology leadership—eroded during the 10nm/7nm disasters. The new moat rests on three pillars:
Pillar 1: Manufacturing Capability Restored
| Metric | Intel 18A | Competitive Context |
|---|---|---|
| Transistor Architecture | RibbonFET (Gate-All-Around) | First GAA deployment in commercial HVM |
| Power Delivery | PowerVia (Backside) | Industry first—superior power efficiency for AI chips |
| Performance vs. Intel 3 | +15% perf/watt, +30% density | Meaningful generational improvement |
| Fab 52 (Arizona) Capacity | ~40,000 WSPM | Exceeds TSMC Arizona Fab 21 Phase 1+2 combined |
Our take: The technology is real. RibbonFET + PowerVia is a genuine breakthrough that positions Intel competitively against TSMC’s N2. The question is whether yields can support profitable production at scale.
Pillar 2: The “Geopolitical Moat”
The August 2025 equity conversion fundamentally changed Intel’s strategic position:
| Component | Detail |
|---|---|
| Government Stake | ~10% equity (converted from $8.9B grants) |
| Claw-back Provisions | Eliminated |
| Secure Enclave Program | Intel as primary provider for DoD trusted logic |
| Regulatory Shield | High barrier for foreign competitor entry in defense/critical infrastructure |
The implication: Intel doesn’t need to beat TSMC on cost. It needs to be “good enough” while offering something TSMC can’t—a fully domestic supply chain from wafer fab to advanced packaging. For customers who need supply chain resilience or security clearance, Intel is the only option.
Pillar 3: Ecosystem Lock-In Potential
| Asset | Strategic Value |
|---|---|
| EMIB Packaging | Competitive alternative to TSMC’s CoWoS-L for large AI chips |
| Foveros 3D Stacking | Heterogeneous integration for chiplet designs |
| 18A PDKs Released | External customers can now design on the node |
| Apple Foundry Deal (Reported) | Validates external IP/process viability |
Moat Assessment: Narrow but Strengthening
We view Intel’s moat as “Narrow” with upside potential to “Wide” if:
- 18A yields reach industry-standard levels (projected end of 2026)
- Two or more major external foundry customers commit by Q3 2026
- Advanced packaging capacity scales without bottlenecks
Technology Deep Dive: Panther Lake vs. The Competition
The Core Ultra Series 3 “Panther Lake” is Intel’s 18A proof point—the first commercial deployment of RibbonFET and PowerVia in a consumer product.
Architecture Breakdown
| Component | Specification | Competitive Significance |
|---|---|---|
| Compute Tile | Up to 16 cores (P/E/LP-E mix) on 18A | +15% perf/watt vs. Intel 3 |
| Graphics Tile | Xe3 “Battlemage” (up to 12 cores) | 73% better graphics vs. AMD Ryzen AI HX 370 |
| AI Processing | NPU 5 (50 TOPS) + GPU (120 TOPS) | 180 Platform TOPS combined |
| Claimed Battery | 27 hours | “Battery Life King” positioning |
Competitive Matrix: The AI PC Battleground
| Feature | Intel Panther Lake | AMD Ryzen AI 400/Max | Qualcomm X2 Plus |
|---|---|---|---|
| Process | Intel 18A | TSMC (Zen 5) | TSMC N3P |
| Standalone NPU | 50 TOPS | 50-60 TOPS | 80 TOPS |
| Platform AI (Max) | 180 TOPS | N/A | N/A |
| Graphics | Xe3 (12 cores) | RDNA 3.5 (up to 40 CUs) | Adreno X2 |
| Key Claim | Battery life + Graphics | Workstation/Creator | Multi-day battery + NPU |
vs. Qualcomm (Snapdragon X2 Plus)
→ Qualcomm wins on dedicated AI: The Hexagon NPU at 80 TOPS significantly outperforms Intel’s 50 TOPS standalone NPU. For background AI workloads without waking CPU/GPU, Qualcomm has the edge.
→ Intel wins on graphics: The Arc B390 GPU delivers discrete-class performance at 120 TOPS—targeting creative and gaming workloads where Snapdragon is less competitive.
→ The real battleground: Qualcomm’s ARM architecture challenges Intel’s x86 dominance in battery-efficient designs. But x86 compatibility and software ecosystem remain Intel’s structural advantage.
vs. AMD (Ryzen AI 400 & Max)
→ NPU parity: AMD’s XDNA 2 delivers 50-60 TOPS—essentially tied with Intel’s NPU 5.
→ AMD wins on workstation: The “Strix Halo” (Ryzen AI Max) platform integrates massive GPUs (40 CUs) with unified memory up to 128GB. AMD claims DGX Spark-comparable performance for specific AI models.
→ Market positioning divergence: Intel focuses on mainstream efficiency; AMD targets the high-end creator/workstation segment. Both have viable strategies.
vs. Broadcom (AVGO)—The Infrastructure Challenge
This is Intel’s steepest mountain. Broadcom dominates custom AI accelerators (ASICs) with entrenched hyperscaler relationships:
| Hyperscaler | Broadcom Engagement |
|---|---|
| TPU | |
| Meta | MTIA |
| OpenAI | Upcoming inference chips (reported) |
→ Intel’s angle: Position Intel Foundry Services (IFS) as a “systems foundry” combining wafer fab + advanced packaging + software. The 18A PowerVia architecture offers superior energy efficiency for high-performance AI chips vs. standard front-side power delivery.
→ The challenge: Broadcom’s networking silicon (Tomahawk, Jericho) creates ecosystem lock-in for million-XPU AI clusters. Intel must compete on foundry services, not direct product competition.
Valuation Analysis & Price Target Scenarios
Intel’s valuation reflects a market that’s simultaneously skeptical and hopeful—a classic turnaround setup with wide outcome dispersion. Friday’s 17% plunge after Q4 earnings illustrates the volatility inherent in this name.
Current Trading Multiples
| Metric | Intel | AMD | Broadcom | Context |
|---|---|---|---|---|
| P/S (TTM) | ~3.5x | ~10.9x | ~26.3x | Significant discount to AI peers |
| P/E (Forward 2026E) | ~55x | ~25x | ~30x | Premium reflects recovery expectations |
| P/B | ~1.0x | ~4.5x | ~12x | Bears anchor to book value |
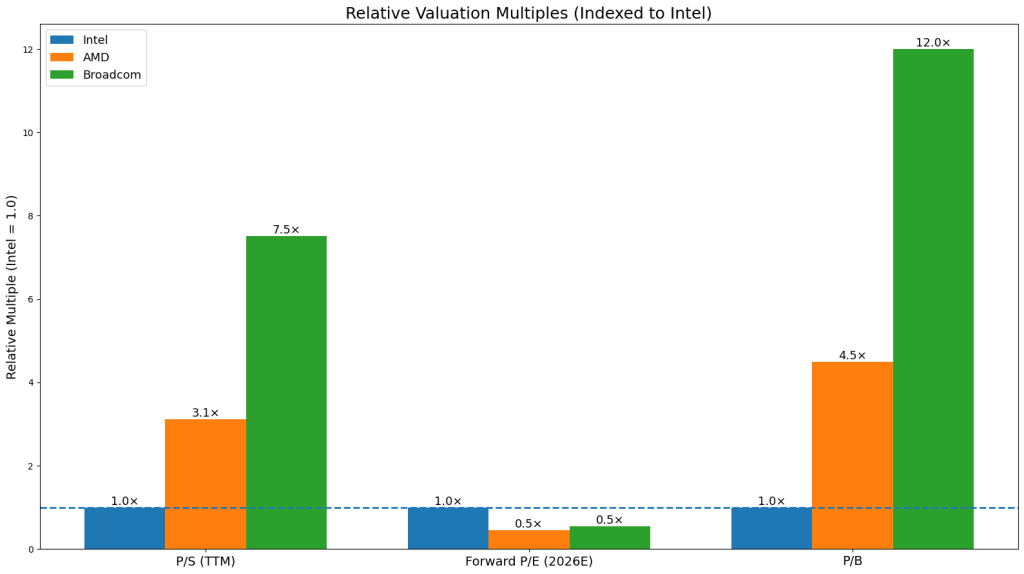
Our interpretation: The ~3.5x P/S reflects Intel’s hybrid identity—neither a pure foundry (which would command TSMC’s 8-9x) nor a high-growth AI company (AMD/AVGO territory). The market is assigning a “show me” discount until foundry economics prove out.
Our Price Target Framework
We derive our targets from a blended methodology: sum-of-the-parts for the product and foundry businesses, with scenario-weighted multiples based on execution probability.
Bull Case: $65 (+47% upside)
| Segment | Methodology | Value |
|---|---|---|
| Intel Products | 22x CY27E Product EPS (~$2.20) | $48.40/share |
| Intel Foundry | 3.5x CY27E Foundry Revenue (~$22B) | $16.60/share implied |
| Total | $65 |
What needs to go right:
- 18A yields reach mature levels (70%+) by mid-2026
- Apple foundry deal confirmed publicly with 2027 production timeline
- At least one additional major customer commits (NVIDIA packaging, AWS, etc.)
- Server CPU supply constraints enable 10-15% price increases
- Foundry segment losses narrow to <$1.5B quarterly by end of 2026
Base Case: $48 (+8% upside)
| Segment | Methodology | Value |
|---|---|---|
| Intel Products | 16x CY27E Product EPS (~$1.80) | $28.80/share |
| Intel Foundry | 2.5x CY27E Foundry Revenue (~$18B) | $19.20/share implied |
| Total | $48 |
What this implies:
- 18A yields reach 60-65%—adequate but not leading-edge
- Foundry customer engagement continues without major commitments in 2026
- PC/Server markets stable, market share losses slow but don’t reverse
- Foundry losses continue at $2B+ quarterly through 2026
- Government support remains but no additional catalysts
Bear Case: $28 (-37% downside)
| Segment | Methodology | Value |
|---|---|---|
| Intel Products | 10x CY27E Product EPS (~$1.40) | $14.00/share |
| Intel Foundry | 1.5x CY27E Foundry Revenue (~$15B) | $14.00/share implied |
| Total | $28 |
What triggers this:
- 18A yields plateau below 55%
- No major external foundry customers by end of 2026
- Apple diversifies away from Intel across categories
- AMD and ARM alternatives accelerate share gains in both client and server
- China revenue materially declines from localization policies
- Credit downgrade to sub-investment grade triggers financing concerns
Scenario Probability & Expected Value
| Scenario | Target | Probability | Weighted Value |
|---|---|---|---|
| Bull | $65 | 25% | $16.25 |
| Base | $48 | 50% | $24.00 |
| Bear | $28 | 25% | $7.00 |
| Expected Value | $47.25 |
Our take: At $44.25, Intel is trading slightly below our probability-weighted expected value of $47.25. The risk/reward is modestly favorable, but the wide dispersion ($28-$65) means position sizing matters more than entry point precision.
Risk Assessment: The Headwinds
1. Execution Risk: 18A Yields
The core issue: Intel management describes current yield state as moving from “unhappy to unsatisfied”—industry-standard yields expected only by end of 2026.
| Yield Status | Implication |
|---|---|
| Current (~60%) | Sufficient for product launches but not cost-competitive |
| Target (70%+) | Required for profitable foundry operations |
| Timeline | Late 2026 / 2027 for full cost structure benefits |
→ What to watch: Gross margin trajectory. Lower-than-expected yields directly impact margins on Panther Lake and server products.
2. Competitive Intensity: Share Loss Continues
| Segment | Threat | Severity |
|---|---|---|
| Data Center | AMD server CPU share gains | High |
| Data Center | Hyperscaler ARM designs + NVIDIA GPU shift | Critical |
| Client | ARM-based alternatives (Qualcomm, Apple Silicon) | Medium |
| Client | AMD x86 alternative | Medium |
→ Reality check: Intel continues losing server market share to AMD through 2026. The “effectively zero response” to NVIDIA’s AI dominance is the existential issue.
3. Financial Pressure: Capital Intensity
| Metric | 2025 | Context |
|---|---|---|
| Foundry Operating Loss (Q3 2025) | $2.3B | Single quarter |
| Gross CapEx Target | ~$18B | Building foundry capacity |
| R&D + CapEx Intensity | >40% of revenue | Constraining FCF |
| Foundry Profitability | 2027+ | Best case scenario |
→ Credit implications: Fitch downgraded Intel to ‘BBB’ (Negative Outlook) citing weak credit metrics. Moody’s at ‘Baa2’. Further deterioration possible if foundry losses persist.
4. Geopolitical Risk: China Exposure
| Factor | Detail |
|---|---|
| China Revenue | ~30% of total |
| Localization Policy | Chinese government phasing out U.S. processors from government systems |
| Export Controls | Escalating tariffs on high-performance ICs |
| Supply Chain | Rare earth mineral export limitations |
→ The double-edged sword: Geopolitical tension creates Intel’s “sovereign moat” while simultaneously threatening 30% of revenue.
5. Guidance Miss Pattern
Friday’s 17% drop after Q4 earnings illustrates the problem: Intel beat on the quarter but guided Q1 significantly below consensus ($12.2B vs. expectations). The market punishes guidance misses harshly—even when they come with beat-and-raise narratives on other metrics. This pattern of “beat the quarter, miss the guide” creates ongoing volatility.
Expert Sentiment: The 2026 Litmus Test
Industry analysts and former executives view early 2026 as the definitive “prove-it” period.
The Consensus View
| Expert | Role | Sentiment | Key Insight |
|---|---|---|---|
| Former Intel Design Lead | Bullish | “18A is do or die”—focus now purely on execution | |
| Former Intel Chief of Staff | Skeptical | Credibility gap requires ~2 years of reliable performance to fix | |
| Wipro Head of Function | Cautious | Yields improving 7-8% MoM but still trail TSMC maturity | |
| Former Intel Director | Urgent | Lack of signed contracts by Q3 2026 = major warning sign |
The Q3 2026 Deadline
A Former Director at Intel warns: if the company does not announce firm contracts by end of Q3 2026, it should be considered a “red flag.” Engagement is positive—but engagement without commitment signals deeper issues.
NVIDIA vs. AMD Dynamics
NVIDIA is closer to bringing real business to Intel Foundry than AMD—”the competitive bridge with AMD is more burned down.” NVIDIA views itself as far above the competition and is more open to using Intel as a capacity partner.
→ Strategic “second source” value: Competitors have vested interest in keeping Intel Foundry alive to avoid complete TSMC reliance. But they’d “definitely prefer the foundry to be separate” from Intel’s product business.
The Investment Thesis: Two Ways to Play
Thesis 1: Turnaround Bet (Constructive)
For: Long-term investors with 18-36 month horizons who believe execution will prove out.
| Factor | Assessment |
|---|---|
| Entry Point | Current ~$44 levels post-selloff |
| Target | $48-65 (base-to-bull case) |
| Catalyst | Q3 2026 foundry contract announcements |
| Risk Management | Position size appropriate for binary outcome |
| Stop Loss | Meaningful break below $28 (bear case validation) |
What you’re betting on:
- 18A yields continue improving to industry-standard by late 2026
- Apple foundry deal is real and announced
- At least one additional major customer commits
- Server CPU pricing power materializes from supply constraints
- NVIDIA partnership generates revenue, not just headlines
Thesis 2: Value Trap Avoidance (Cautious)
For: Investors who see structural challenges outweighing turnaround potential.
| Factor | Assessment |
|---|---|
| Concern | Forward P/E still elevated for execution-challenged company |
| Competitive Position | Market share losses to AMD and ARM not reversing |
| Capital Requirements | $18B+ annual CapEx with negative FCF |
| Foundry Profitability | 2027+ at earliest—long time to burn cash |
| Alternative | AMD, TSM, or AVGO offer cleaner exposure to semiconductor themes |
What you’re avoiding:
- Multi-year execution risk on complex turnaround
- Potential for further credit downgrades
- Continued share loss in core markets
- Political dependency (government stake cuts both ways)
What to Track
- 18A Yield Progression — Quarterly updates on yield trajectory; target 70%+ for validation
- Foundry Customer Announcements — Q3 2026 deadline for “red flag” assessment
- Apple Relationship — Any confirmation of foundry deal; iPhone component share
- Gross Margin Trajectory — Early indicator of yield economics
- Server Market Share — AMD share gains; ARM alternative traction
- Foundry Segment Losses — Narrowing = progress; widening = concern
- CapEx Guidance — Any reduction signals either discipline or capitulation
- Credit Rating Actions — Fitch/Moody’s outlooks and rating changes
- Government Program Updates — Secure Enclave progress; additional CHIPS funding
- NVIDIA/AMD Foundry Signals — Packaging deals often precede wafer commitments
Key Financial Metrics Summary
| Metric | Value |
|---|---|
| Stock Price (Jan 24, 2026) | $44.25 |
| Market Cap | ~$193B |
| 52-Week Range | $17.67 – $54.60 |
| TTM Revenue | ~$55B |
| Q1 2026 Guidance (Midpoint) | $12.2B |
| Foundry Q3 2025 Loss | $2.3B |
| Government Equity Stake | ~10% |
| CapEx Target (2025) | ~$18B |
| P/S (TTM) | ~3.5x |
| 18A Yield (Reported) | >60% |
| China Revenue Exposure | ~30% |
Valuation Summary
| Scenario | Price Target | Upside/Downside | Probability |
|---|---|---|---|
| Bull | $65 | +47% | 25% |
| Base | $48 | +8% | 50% |
| Bear | $28 | -37% | 25% |
| Expected Value | $47.25 | +7% | — |
The Verdict
Intel is neither a clear buy nor a clear avoid—it’s a calculated bet on execution with asymmetric payoffs.
For turnaround-oriented investors: The risk/reward is modestly compelling at current levels if you believe:
- The 18A technology is real (evidence supports this)
- Management can convert engagement to contracts (uncertain)
- The geopolitical moat has durable value (likely)
- You have an 18-36 month horizon (required)
For momentum or quality investors: This isn’t the right name. Execution risk is real, competitive dynamics are challenging, and the foundry business is years from profitability. AMD, TSM, or AVGO offer cleaner semiconductor exposure.
The bottom line: Intel’s 18A is the most important American semiconductor technology in a generation. The company has restored process competitiveness and secured unprecedented government support. But converting that into a profitable foundry business while defending core markets against AMD and ARM alternatives requires flawless execution over multiple years. The market is pricing in significant skepticism—justified by Intel’s track record—while leaving room for substantial upside if execution proves out.
Q3 2026 is the deadline. Watch for signed contracts, not engagement letters.
Disclaimer: This analysis is for educational purposes only and does not constitute financial advice. Conduct your own due diligence and consult with a licensed financial advisor before making investment decisions.